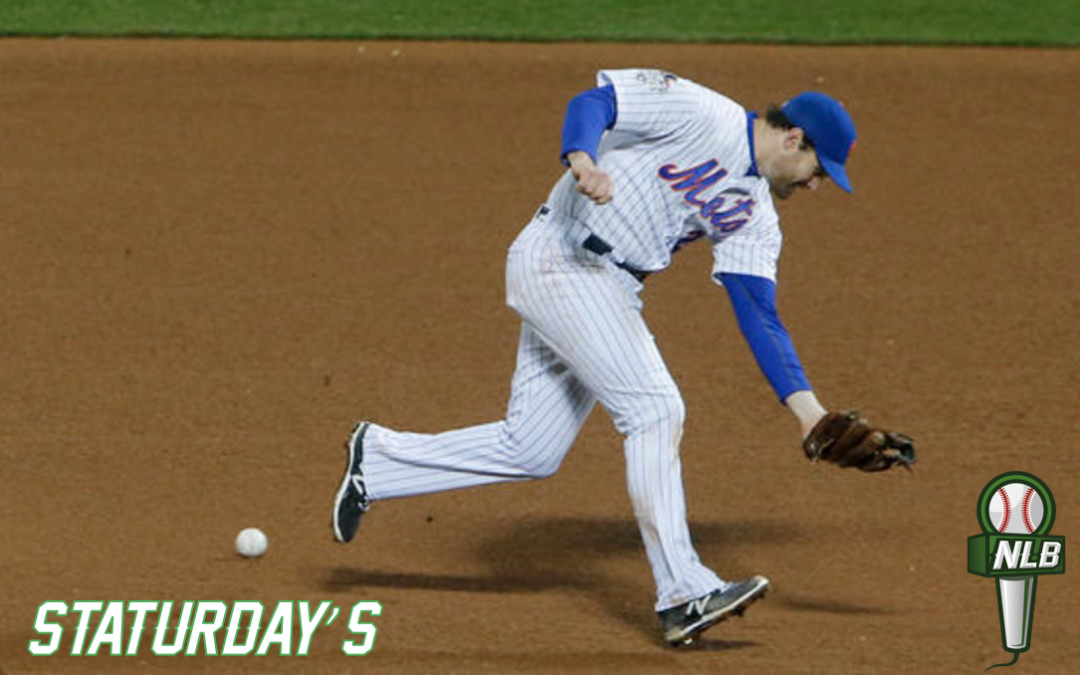
I always stuck to the basics when it came to defensive stats, but in the last few years I have abandoned errors and putouts in favor of UZR (quantifies how many runs a player has saved through his fielding prowess) and DEF (measures a player’s defensive value). If you’ve read Ahead of the Curve by Brian Kenny, you know that an error is a dying metric.
This all leads to my next question: if we have proven that errors don’t effectively evaluate a player’s defense then why do we punish a hitter when he reaches on error? Regardless of whether the hitter has forced the defense’s hand into a tough play or not, why should his OBP suffer? Yes, you will get the occasional routine grounder that is botched, but that should show in the defender’s advanced fielding measures, not docked against the hitter’s success. Measuring reaching on error (ROE) could help teams further evaluate talent going forward.
If there is a certain type of player that’s skillset led to a higher OBP, I’m sure the baseball community would be interested to know why. My goal was to find out what type of hitter benefitted most from ROE. My initial thought was right-handed speedsters; with a lefty hitter pulling to the right side of an infield, a second basemen theoretically has more time to get the ball to first if he bobbles the ball. After further research, speed wasn’t a factor. The big difference was between putting the ball on the ground versus hitting a fly ball. Speed and whether the hitter is left or right handed was irrelevant (only a ¼ % increase between RHB and LHB).
I decided to look at the last three years’ data and compare the Top 10 ground ball % hitters with the Top 10 fly ball % hitters. In the table below are the Top 10 from each category, with an average of 100 games played over the last three years.
| Name | GB% | Name | FB% |
| Nori Aoki (L) | 61.20% | Chris Carter (R) | 50.5% |
| Howie Kendricks (R) | 59.90% | Brandon Moss (L) | 49.3% |
| Christian Yelich (L) | 59.80% | Lucas Duda (L) | 48.30% |
| Dee Gordon (L) | 59.50% | Colby Rasmus (L) | 46.10% |
| Ben Revere (L) | 55.70% | Luis Valbeuna (L) | 45.80% |
| Cameron Maybin (R) | 56.80% | Brian McCann (L) | 45.50% |
| Jean Segura (R) | 55.10% | Brian Dozier (R) | 44.90% |
| Ichiro (L) | 55.00% | Stephen Vogt (L) | 44.50% |
| Wilson Ramos (R) | 54.80% | Todd Frazier (R) | 44.50% |
| Jon Jay (L) | 54.70% | Nolan Arenado (R) | 44.40% |
From there, I looked at each of the player’s game logs from the last three years. If they reached on base via any form of error, they were tallied with a ROE. I then took their OBP and compared it to their rOBP (which essentially looks at ROE as a hit).
| Player | Ground Ball% | OBP | ROE OBP | Change in OBP | ROE |
| Nori Aoki (L) | 61.20% | 0.350 | 0.363 | 13% | 18 |
| Howie Kendricks (RHB) | 59.90% | 0.337 | 0.349 | 12% | 20 |
| Christian Yelich (L) | 59.80% | 0.368 | 0.376 | 8% | 15 |
| Dee Gordon (L) | 59.50% | 0.335 | 0.346 | 11% | 18 |
| Ben Revere (L) | 55.70% | 0.316 | 0.330 | 14% | 22 |
| Cameron Maybin (RHB) | 56.80% | 0.337 | 0.347 | 10% | 12 |
| Jean Segura (RHB) | 55.10% | 0.316 | 0.332 | 16% | 29 |
| Ichiro (L) | 55.00% | 0.317 | 0.328 | 11% | 12 |
| Wilson Ramos (RHB) | 54.80% | 0.305 | 0.316 | 11% | 16 |
| Jon Jay (L) | 54.70% | 0.346 | 0.361 | 15% | 16 |
This showed that, on average, a groundball hitter has an average change of 12.1% in OBP per year, while getting on base 17.8 more times via ROE. Compare that to the top 10 fly ball hitters (table below) and you will see that a fly ball hitter has an average increase of 7.1% in OBP per year, while getting on base 11.8 more times via ROE.
| Player | Fly Ball % | OBP | ROE OBP | Change in OBP | ROE |
| Chris Carter (R) | 50.5% | 0.313 | 0.319 | 6% | 10 |
| Brandon Moss (L) | 49.3% | 0.314 | 0.317 | 3% | 5 |
| Lucas Duda (L) | 48.30% | 0.344 | 0.349 | 5% | 7 |
| Colby Rasmus (L) | 46.10% | 0.297 | 0.303 | 6% | 7 |
| Luis Valbeuna (L) | 45.80% | 0.334 | 0.342 | 8% | 11 |
| Brian McCann (L) | 45.50% | 0.313 | 0.318 | 5% | 11 |
| Brian Dozier (R) | 44.90% | 0.330 | 0.340 | 10% | 19 |
| Stephen Vogt (L) | 44.50% | 0.322 | 0.331 | 9% | 12 |
| Todd Frazier (R) | 44.50% | 0.316 | 0.327 | 11% | 22 |
| Nolan Arenado (R) | 44.40% | 0.339 | 0.347 | 8% | 14 |
I’m not trying to argue that since groundball hitters get on base more via the “error” they are more valuable; my point is that the steep increase in OBP for ground ball hitters makes ROE a stat worth tracking. Obviously fly ball hitters provide value in other place, but ROE is one where ground ball hitters shine.
In a fly-ball happy league, the teams that are measuring ROE will be able to provide value that is currently being overlooked. The best analytical teams are always looking for the next edge; when the rest of the league will be looking at fly ball hitters who drive the ball, the cutting-edge teams will be looking at ROE.


